With Java 8 Streams, we are now able to process elements in streams in functional style; in declarative way. This has made processing elements easier and with an option to do these processing operations parallelly.
One of the problem people face with large stream pipeline is that when these pipelines need to be debugged. Suppose there are 10 intermediate operations being performed on a stream pipeline. And the output from the net stream is not coming as expected. So a developer would need to debug and see which intermediate operation is actually causing the issue.
The problem is that the stream pipelines are not easy to debug. Even if you put debug points in the code for Java stream, only those debug points will get executed where instructions are written inside curly braces. Debug points put across method references do not work well. Hence, it becomes cumbersome to debug stream pipeline.
🎯 Java Stream Debugger Plugin
Jetbrains offers a plugin called Java Stream Debugger plugin which you can install in your IntelliJ IDEA. This plugin comes pre-installed and enabled in recent versions of the IntelliJ IDEA, but in case you have an older version of the installation then you can install this plugin.
You can find link to the plugin here.
This plugin evaluates the entire stream pipeline, and shows output based on every operation plugged into the stream.
🎯 Plugin Demonstration
Let’s start with writing a Java stream.
We have a List<Greeting> object which we want to stream, and get List<String> object. String value in the output list denotes the Greeting object’s message attribute and these are those messages whose corresponding id is an even number.
So, the Greeting class has below attributes.
public class Greeting {
  private long id;
  private String message;

  // getters setters constructors
}
Let’s have a look on the stream where we are using List<Greeting> and generating List<String> object.
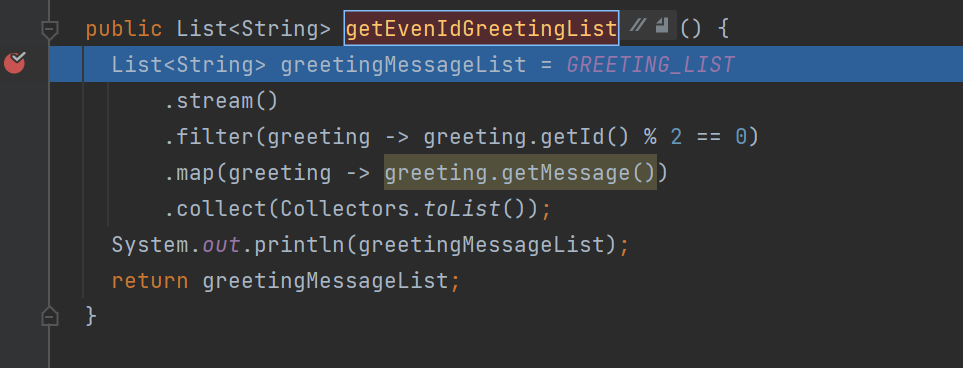
public List<String> getEvenIdGreetingList() {
    List<String> greetingMessageList = GREETING_LIST
        .stream()
        .filter(greeting -> greeting.getId() % 2 == 0)
        .map(greeting -> greeting.getMessage())
        .collect(Collectors.toList());
    return greetingMessageList;
}
The GREETING_LIST is a hard coded list of Greeting. Quickly showing you below how I had constructed this.
private static final List<Greeting> GREETING_LIST = Arrays.asList(
      new Greeting(1, "Greeting Message 1"),
      new Greeting(2, "Greeting Message 2"),
      new Greeting(3, "Greeting Message 3"),
      new Greeting(4, "Greeting Message 4"),
      new Greeting(5, "Greeting Message 5"),
      new Greeting(6, "Greeting Message 6"));
Let’s start the debugging.
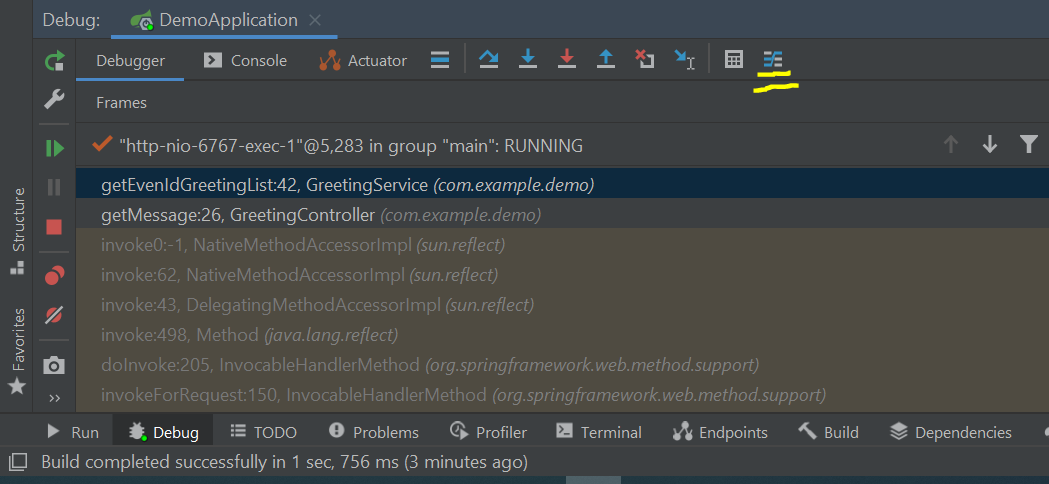
I have put the debug point at the start of this stream. Let’s start the debugging now.
In the Debug tab of IntelliJ, click on the icon which I have highlighted in the screenshot below. This will bring up the dialog where stream will be evaluated.
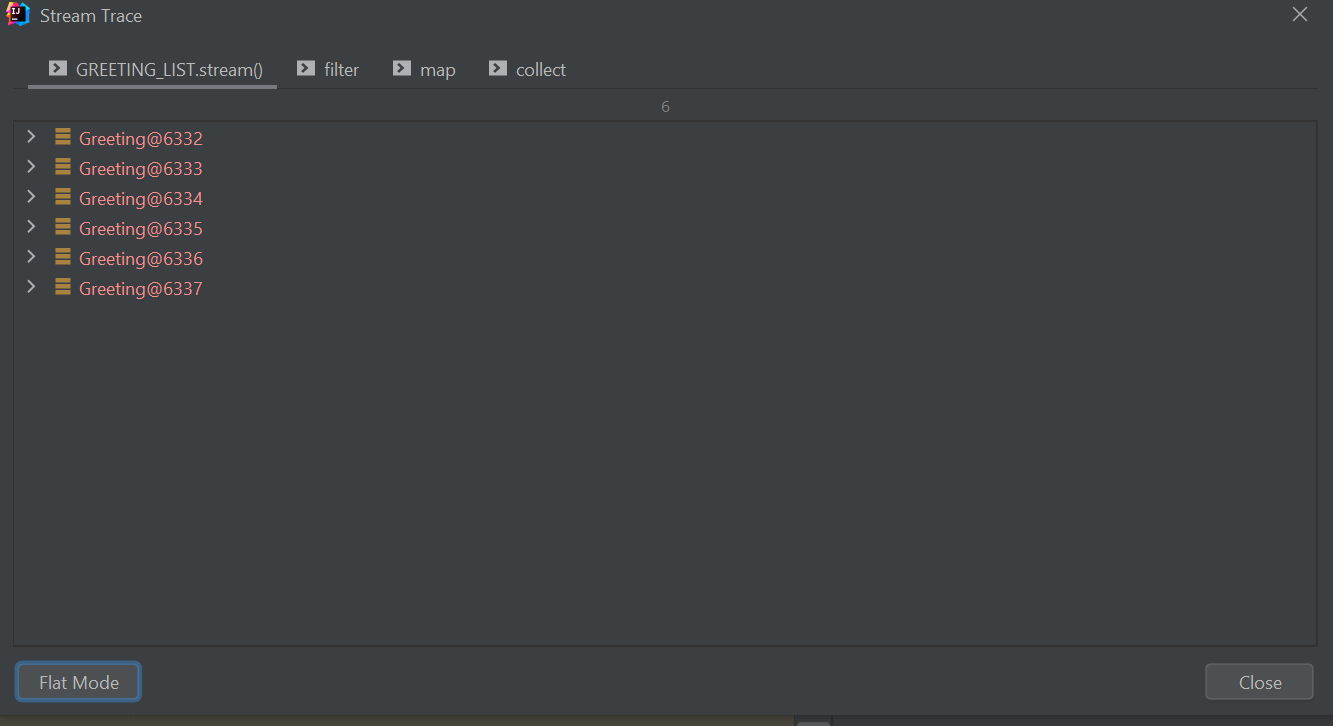
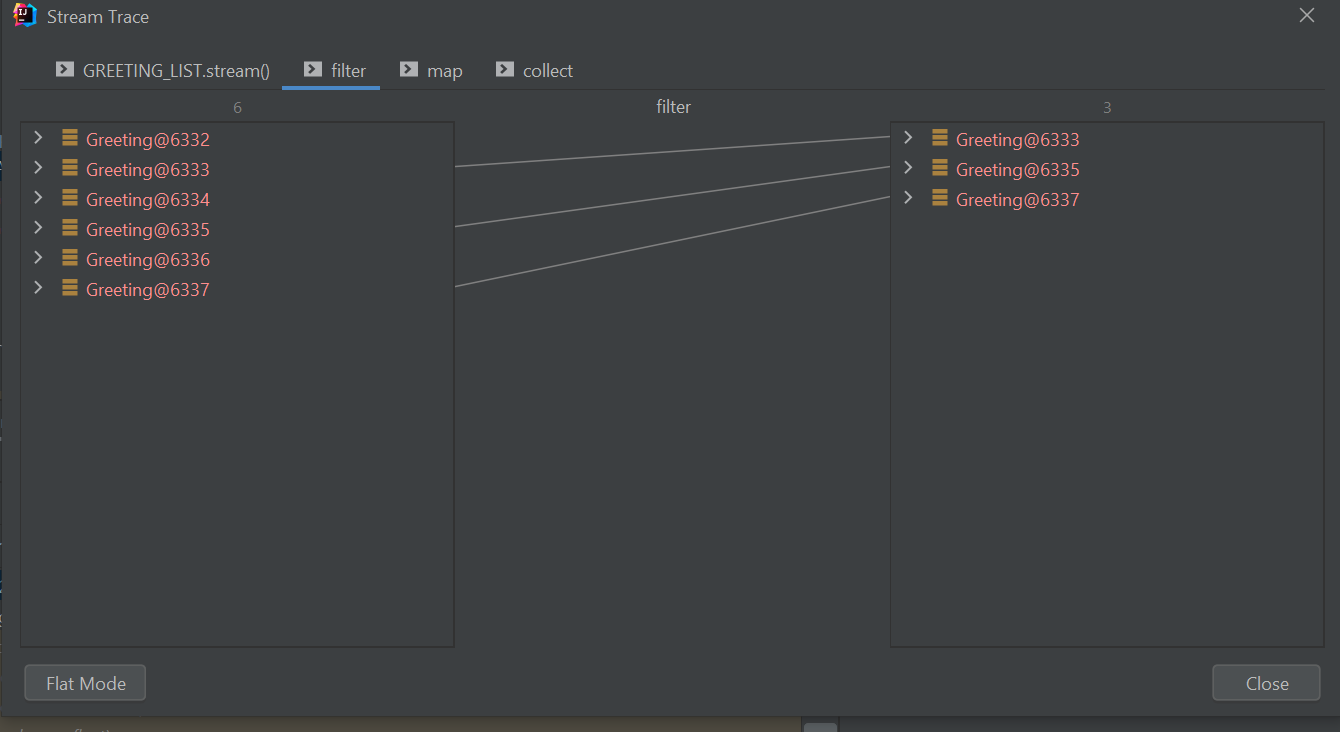
You will be able to see the stream trace. It will show evaluated result against each of the operation. For example, after applying the filter operation we get below result:
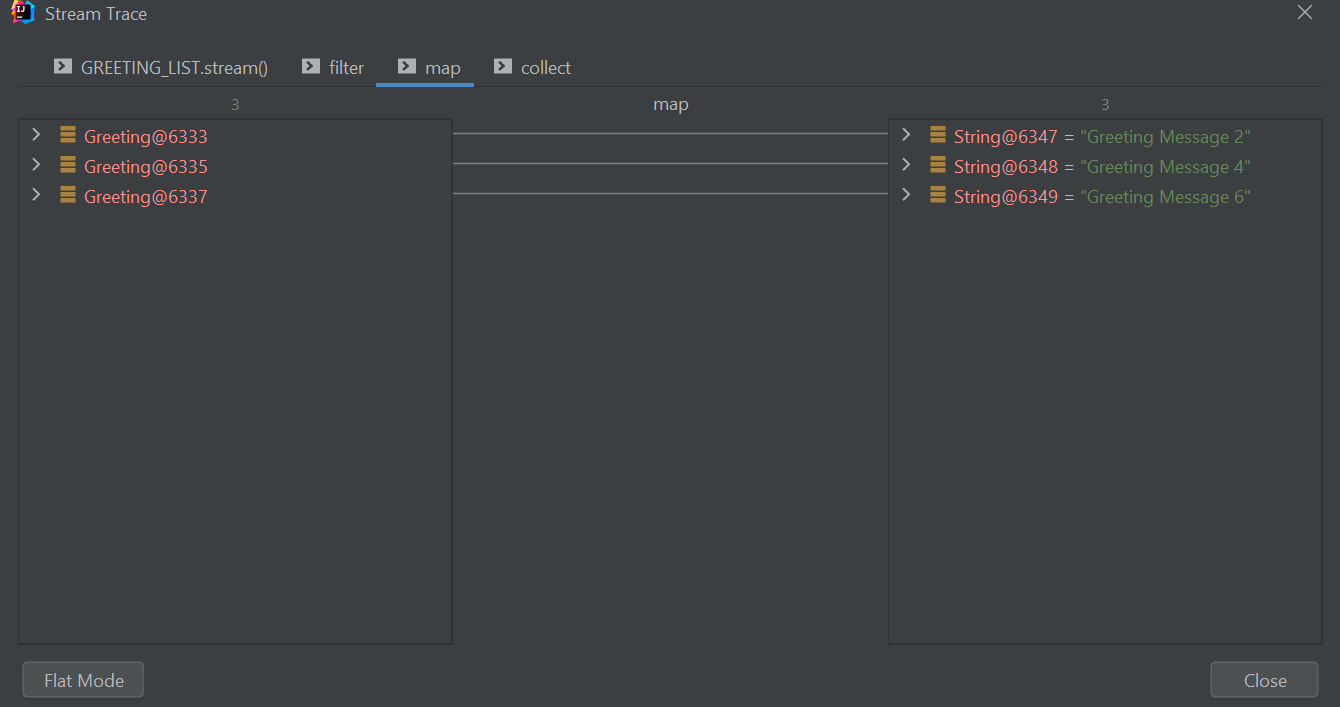
The map operation gives below result, which is now List<String>:
collect terminal operation gives below result:
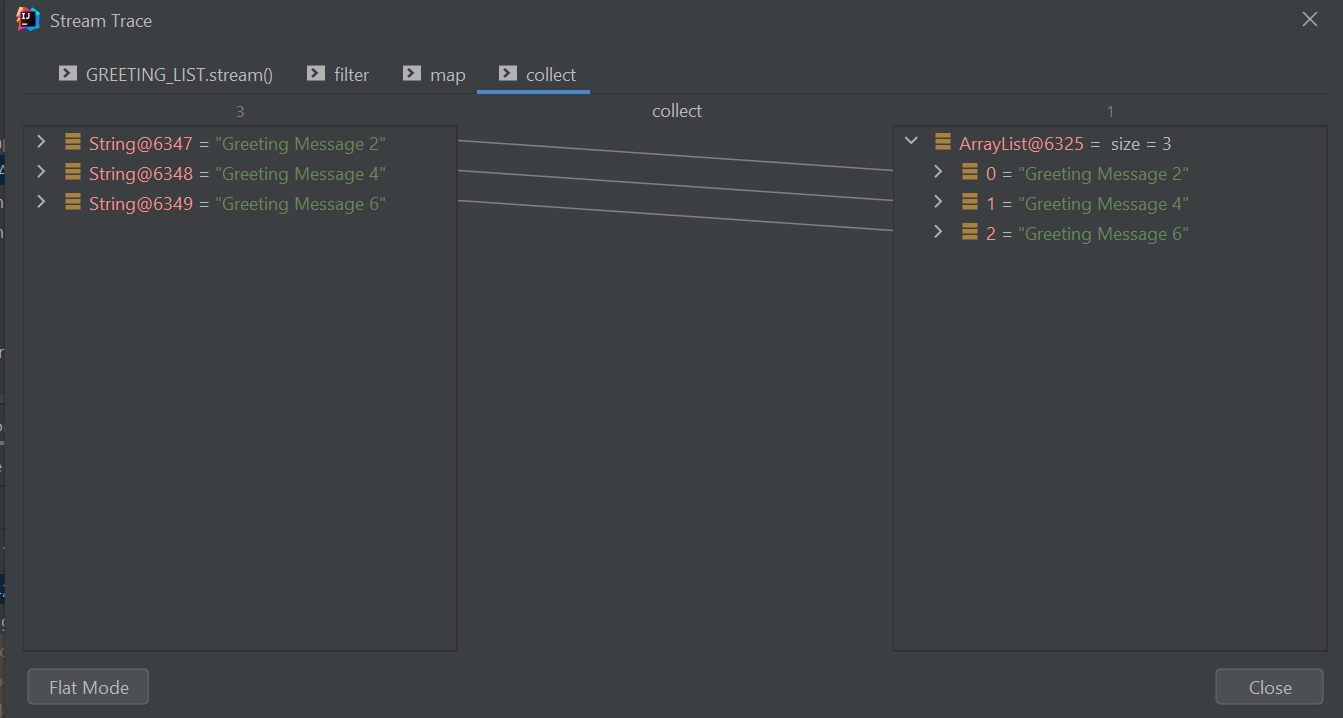
This is how you can see the evaluation of your Java stream pipeline with ease, and debug for your use cases. Output from each operation in the stream is shown in a separate tab in the stream trace dialog window, just like I showed you in screenshots above.
🎯 Conclusion
In this post we explored the Java Stream Debugger plugin, which is one of the most important tool to have in your toolkit as a Java developer. It helps to see the evaluation of Java streams with ease, and you can perform your debugging.
If you found this post useful, please show some love by leaving a comment for me and by sharing this article.