This is a two parts series where we have covered Distributed Tracing in a Spring Boot application using Jaeger. This is part 1 of the series.
In this article we will try to understand what is distributed tracing, and how can we implement that in our Spring Boot projects.
🎯 What is distributed tracing?
Distributed tracing, also sometimes referred to as Request tracing, refers to the solution using which we can monitor requests flowing through the different applications or components in a distributed architecture. It allows teams to link the operations and requests occurring between multiple of their services together.
In a monolith application we a single entity which is doing all the thing for you. So if you have to monitor a request, then you are sure that the request will be travelling under the periphery of your own application only. Hence, monitoring a request in monolithic architecture based applications is comparatively easy.
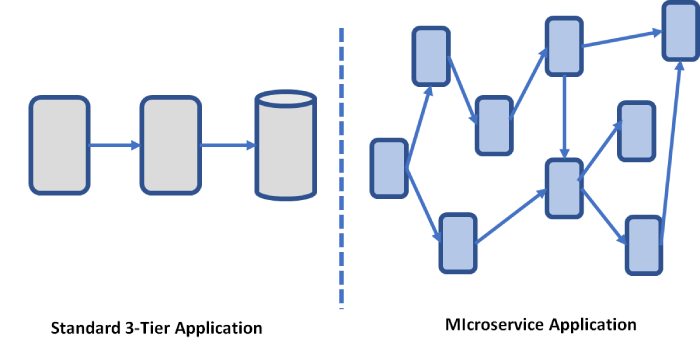
Today we are dealing with distributed architecture mostly. This is comprised of several independent small applications which work together to serve a request from the user. These smaller distributed applications could be yours, or may be they are being managed by different teams, or different enterprises altogether.
In such an architecture of distributed nature, suppose you found that a particular request processing is taking longer than the usual time, and you must find out that bottleneck in the application flow. How will you find out the bottleneck in the request flow when all the moving pieces are not in your control? A single user request can travel through hundreds or thousands of microservices.
To quickly identify where things are going wrong, you need a central overview of how requests are performing across services. If you could visualize the entire flow and have ample data at your hand as the request flows through the smaller applications, you will be in a position to find out the bottleneck. After you have found the bottleneck then may be you can connect with the team who is responsible for handling that component which is causing the issue, and ask them to analyze the issue. This is the core happiness that distributed tracing has to offer you. With a great distributed tracing tool can improve your team’s response to performance issues, thereby improving the end-user experience.
🎯 Solutions available for implementing distributed tracing
There are several solutions available to us at this point using which we can implement distributed tracing in our projects. Few popular solutions are:
- Jaeger
- Zipkin
- Dynatrace
- Lightstep
- Splunk
There are even more solutions available. I named only a few of them here. In this article I will be talking about Jaeger, and implement that in a Spring Boot project.
🎯 Key terms used in any distributed tracing solution
Before diving into the implementation of any solution in our projects, let’s go through two key terms that are very important.
- Span: Span describes an operation or work taking place on a service. Like a web server responding to an HTTP request or a single invocation of a function. It is the most granular level of information.
- Trace: Trace describes the end to end journey of one or more connected spans. It is considered to be distributed if its spans are across multiple services.
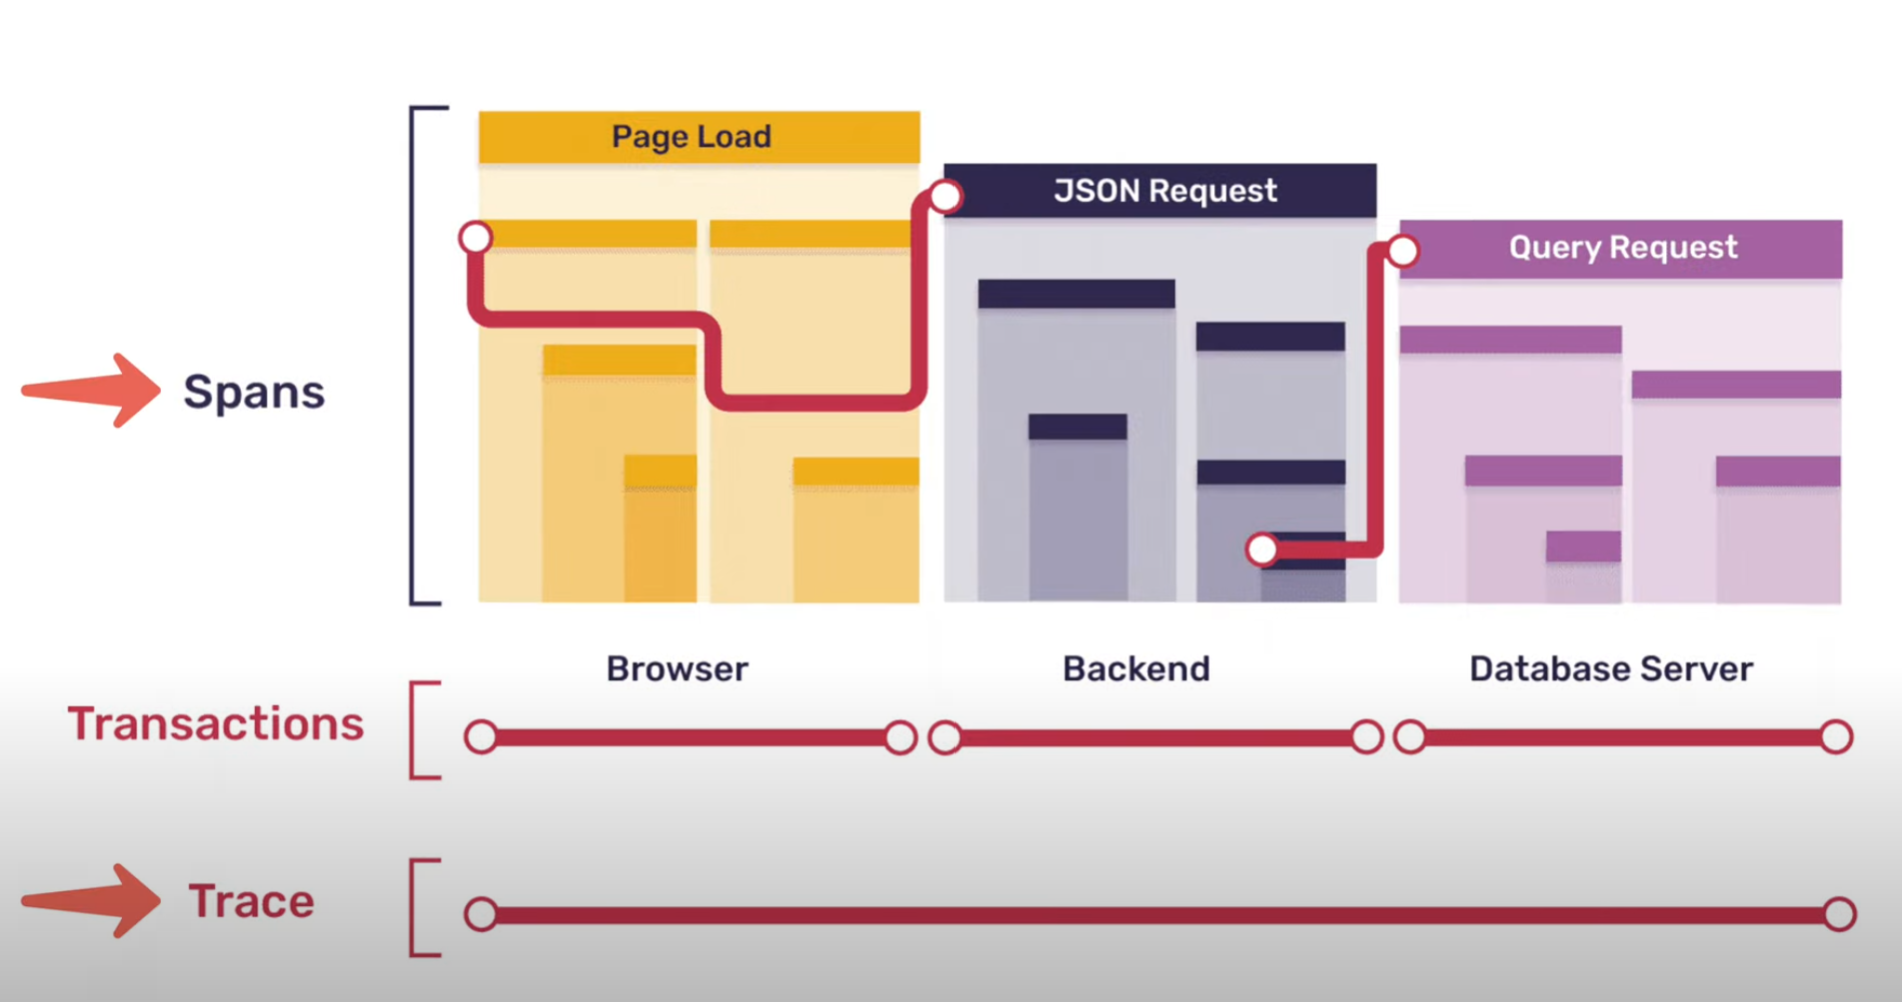 In this picture you can see that spans are confined to a service/application. They reside under their application only. However, trace covers the entire journey of a request, and they cover all the involved services/applications. A trace id will be unique for a request in all the services.
When we will be analyzing a trace later here, we will be going through various spans which are present inside it, and get information from every span.
🎯 Overview of services we are developing with Jaeger integrated in them
This solution has been developed by Uber to solve end to end distributed tracing problem across micro services.
We will be creating two spring boot micro services, and include Jaeger maven dependency in both of them.
- Service 1: initiator-service
- Service 2: orchestrator-service
User will be interacting via Service 1. Service 2 will make a call to an external API called numbers API, which will return response to Service 2 and Service 2 will return response to Service 1. Service 1 will give this response to the end user.
In both these micro services, we have Spring Web dependency only present as of now.
<dependency>
	<groupId>org.springframework.boot</groupId>
	<artifactId>spring-boot-starter-web</artifactId>
</dependency>
In initiator-service we have a controller:
@RestController
@RequestMapping("/v1/api/initiator")
public class InitiatorController {

  private InitiatorService initiatorService;

  public InitiatorController(
      InitiatorService initiatorService) {
    this.initiatorService = initiatorService;
  }

  @GetMapping("/data/{id}")
  public ResponseEntity<String> getData(@PathVariable("id") int id) {
    return ResponseEntity.ok(initiatorService.getData(id));
  }
}
The InitiatorService goes like below:
@Service
public class InitiatorService {

  private RestTemplate restTemplate;

  public InitiatorService(RestTemplate restTemplate) {
    this.restTemplate = restTemplate;
  }

  public String getData(int id) {
    return restTemplate.getForObject("http://localhost:9092/v1/api/orchestrator/data/" + id,
        String.class);
  }
}
The initiator-service is running on port 9091.
This is a very simple service which basically calls orchestrator-service.
In orchestrator-service we have a controller:
@RestController
@RequestMapping("/v1/api/orchestrator")
public class OrchestratorController {

  private OrchestratorService orchestratorService;

  public OrchestratorController(
      OrchestratorService orchestratorService) {
    this.orchestratorService = orchestratorService;
  }

  @GetMapping("/data/{id}")
  public ResponseEntity<String> getData(@PathVariable("id") int id) {
    return ResponseEntity.ok(orchestratorService.getData(id));
  }
}
We have a OrchestratorService present:
@Service
public class OrchestratorService {

  private RestTemplate restTemplate;

  public OrchestratorService(RestTemplate restTemplate) {
    this.restTemplate = restTemplate;
  }

  public String getData(int id) {
    return restTemplate.getForObject("http://numbersapi.com/" + id, String.class);
  }
}
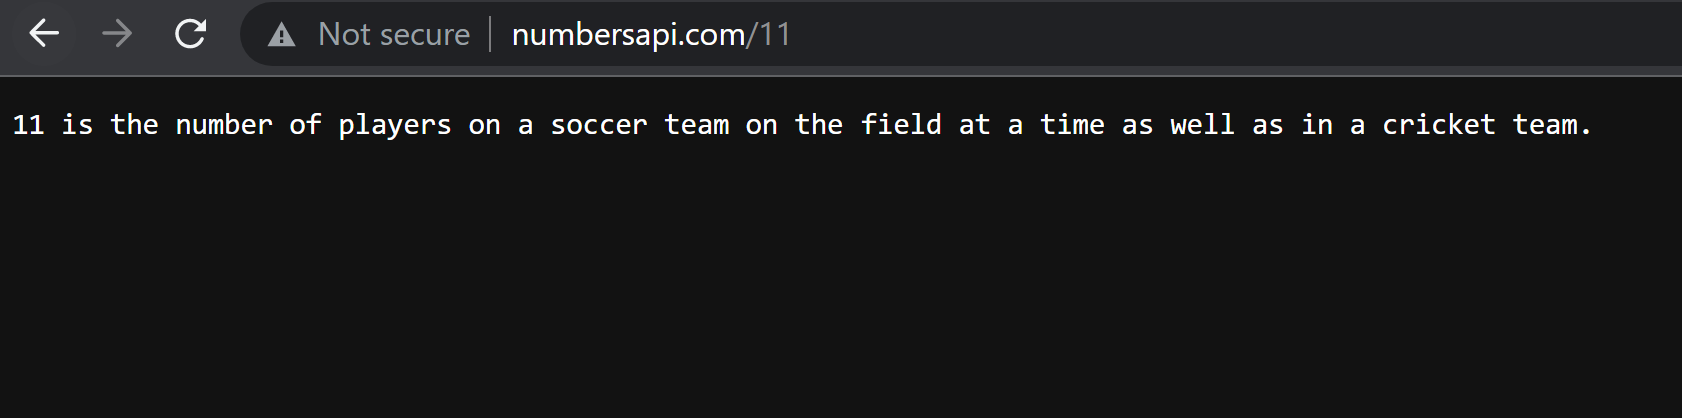
The orchestrator-service runs on port 9092. It makes a call to Numbers API. This is an external API which serves get request on its endpoint: http://numbersapi.com/{id}.
The {id} here is any integer value. This API returns a fact about the number passed.
For example when we make a call to numbersapi.com/11, we get a String response which is a fact on number 11.
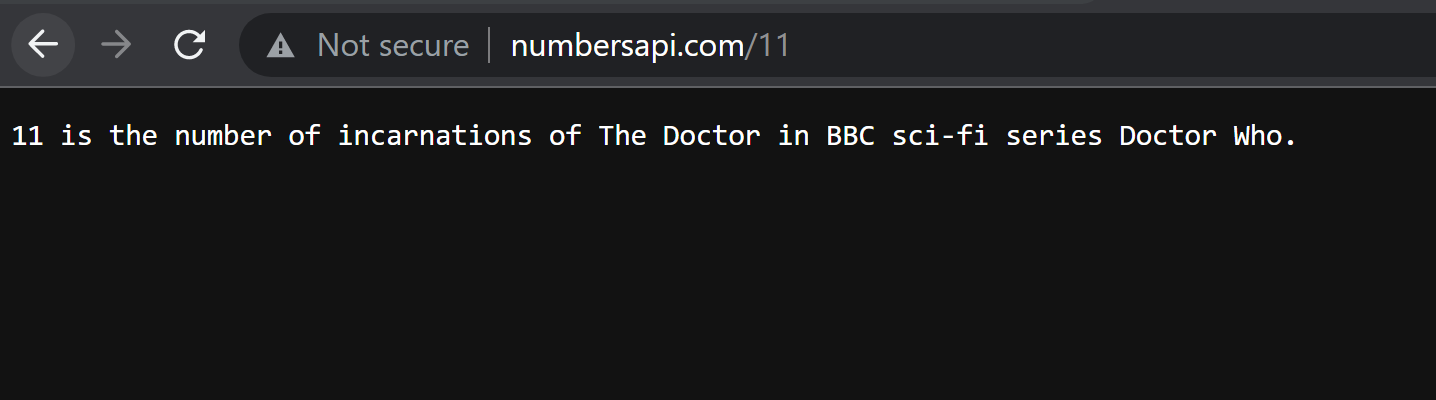
If you hit this endpoint again, you might get another response fact on the number 11.
Okay! I hope now you are clear on the basic set of services that we have with us. We will include Jaeger in them now. And by using Jaeger, we will be tracing how our request travelled through these two micro services, Service 1 to Service 2 to Numbers API, and back to Service 1. I have covered all this in very detail in Part 2 of this series. Please check that out.
Complete code changes that I used are present at my Github repository.
If you have any suggestions for me, then please share that with me by commenting below.